Observer Analyzer
Observer Analyzer monitors unified communications (UC) deployments, network security performance, applications, and troubleshoots complex network traffic including VM environments.
Description
With robust and comprehensive analysis, Observer Analyzer offers immediate issue resolution and builds long-term performance improvements. It provides the complete package needed by network managers, architects, and engineers to achieve peak performance:
- Total visibility into network and application health
- High-level to granular views
- Detailed HTTP tracking for client browser and OS type
- Customized Key Performance Indicators (KPIs)
- In-depth troubleshooting with root-cause analysis
- Application performance analytics
- Expert Analysis alerts you to potential problems and solution strategies
- Over 30 real-time statistics including bandwidth usage, LAN use patterns, and more
How do network teams benefit from Observer Analyzer?
They manage the impact of new application rollouts on the network; validate performance for telepresence initiatives; distinguish network issues from application malfunctions; and apply baseline intelligence for preventive management of critical applications. Analyzer is essential for the following:
- Application performance
- Service assurance
- Network performance
- UC deployment
- Complex VM environments
- Cloud computing
From Apple Talk to VoIP, Analyzer delivers individual packets views and decodes over 740 primary protocols and countless sub-protocols.
Key Features
Application Performance
Reduce downtime and increase productivity with in-depth, contextual application analysis. Get response time data for thousands of applications plus performance metrics,transaction detail, and predictive analytics that show the network impact of new application deployments.
Expert Analysis
Get immediate intelligence in both real time and post capture using Expert Events for TCP, UDP, VoIP, Wireless, and more. It tracks and organizes common services, flags response performance by severity, tracks port-based protocols for slow response, and differentiates between network and application problems with local traffic and WAN/Internet traffic distinction. Enhanced HTTP application monitoring offers deep insight into how web-based applications are operating, as well as how users are accessing IT resources, including browser type and operating system.
Conversation Analytics
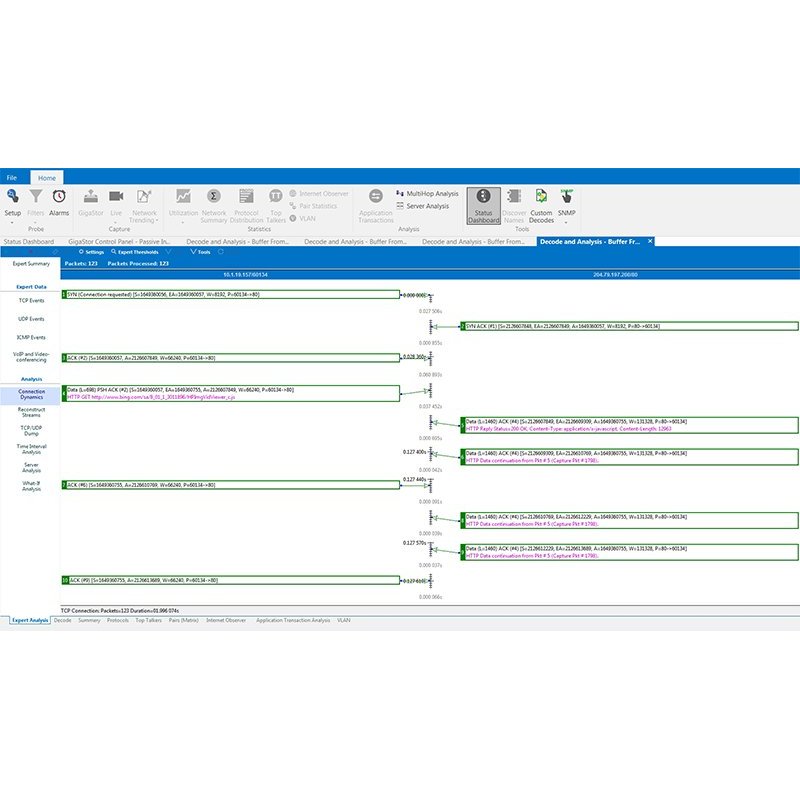
The only network analyzer that offers Connection Dynamics, it graphically breaks down individual network conversations piece-by-piece, pinpointing which request or response is causing the issue. Retransmissions and dropped packets are flagged for instant recognition of the issue source. Spaces between conversation sections identify latency and response time issues. TCP/UDP Expert Events show excessive retransmissions, and provide an explanation of the problem and possible causes.
Trending
Use network trending to forecast IT needs or justify upgrades with comparative reports. View and analyze network traffic stats over periods of time — from days to years. Trending metrics can be broadly applied to meet diverse challenges like translating web traffic into Internet usage data to appropriately bill departments on service use.
Troubleshooting
Perform in-depth troubleshooting with an interface that provides intuitive workflows for quick problem resolution. Deep drill-down capabilities with root-cause analysis pinpoint issues at the source with accuracy and ease. High-performance packet capture, decode, and filtering capabilities offer additional support.
Triggers & Alarms
Analyzer deploys ongoing monitoring of activity levels and immediately sends prioritized alerts when network fluctuations cross your pre-set levels. It gives you the following alert options: emails, paging, trouble tickets, or kick starting an automated packet capture.
Features also include flagging activities or errors from a pre-defined list; setting custom notifications based on any filter; obtaining email with virus information (including source and destination); and placing triggers on any WLAN activity.
Packet Capture
Analyzer’s packet capture, decode, and filtering capabilities are second to none. It lets you view individual packets and decode for over 740 primary protocols and countless sub-protocols. Observer filters packets quickly and efficiently by address, address range, protocol offsets, and protocol presets using the intuitive GUI and by-command line.
Additional information
| Brand | VIAVI Solutions |
|---|---|
| Type | Network Performance Monitoring |

